4. Limon™ BMS Software Live View
All the datas about battery pack can be seen on this screen. All live incoming datas may monitor cell-by-cell, module-by-module. Every field has its own deticated functionality. Each field description can be seen below.
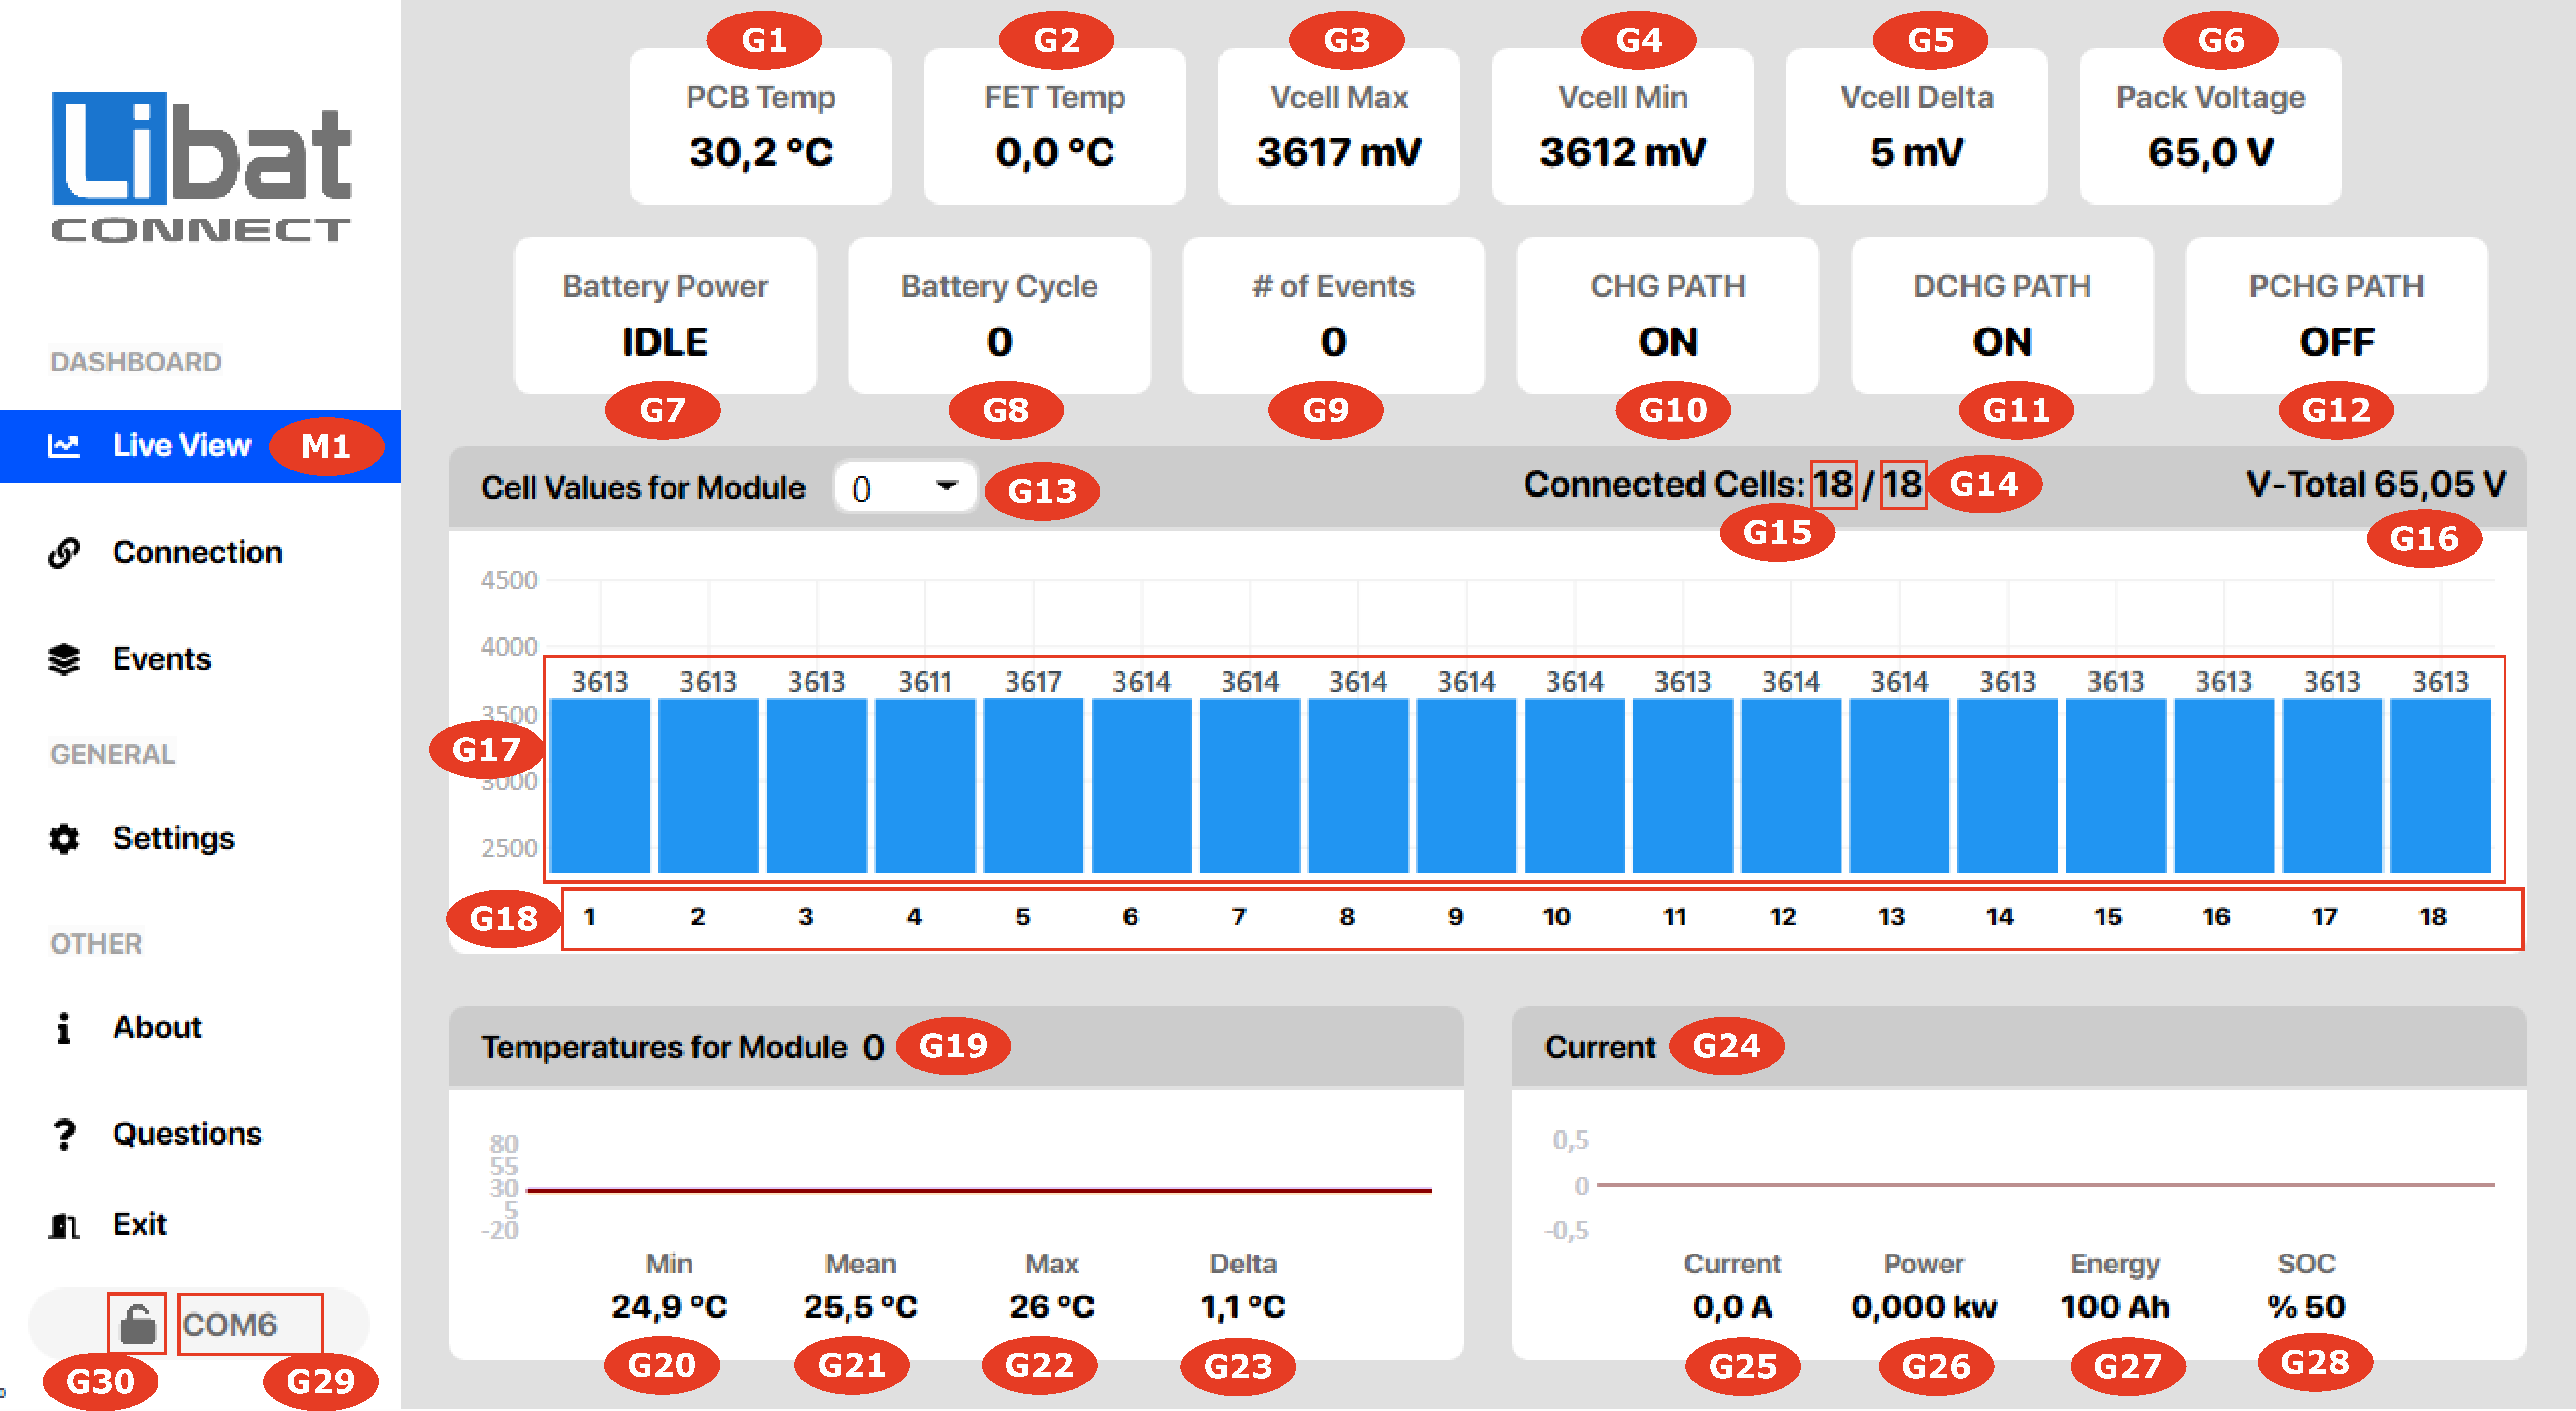
Fig.4.1 Live View Screen
| Field No. | Description |
|---|---|
| M1 | Selection tab for Live View. |
| G1 | Main Module's PCB temperature. |
| G2 | Main Module's FET temperature (if exist, otherwise this field is always shows zero). |
| G3 | Maximum cell value of the whole battery pack. |
| G4 | Minumum cell value of the whole battery pack. |
| G5 | Maximum cell voltage delta/imbalance (Maximum Cell-Minumum Cell). |
| G6 | Total voltage of whole battery pack. |
| G7 | Battery power situation. Stats: CHARGING, DISCHARGING, IDLE |
| G8 | Battery Cycle |
| G9 | Total of number of all events. |
| G10 | Battery pack's charge path situation. Stats: ON, OFF |
| G11 | Battery pack's discharge path situation. Stats: ON, OFF |
| G12 | Battery pack's precharge path situation. Stats: ON, OFF |
| G13 | Module ID selection. |
| G14 | Module cell connection status Setting of Number of Cells |
| G15 | Module cell connection status Detected Cells |
| G16 | Total voltage of battery module. |
| G17 | Cell voltage (mv) and bar level chart. |
| G18 | Balance Status of Cell. If balance is activated for a cell, number is labeled as red circle. |
| G19 | Temperature live chart for selected module. |
| G20 | Minumum temperature for selected module. |
| G21 | Mean temperature for selected module. |
| G22 | Maximum temperature for selected module. |
| G23 | Maximum temperature delta for selected module. |
| G24 | Current value live chart. Current The current level is displayed as line graph. |
| G25 | Current value. Minus sign for discharge, plus sign for charge. |
| G26 | Live power value of the system. Minus sign for discharge, plus sign for charge. |
| G27 | Net energy value of battery pack. |
| G28 | SOC value of battery pack. |
| G29 | Connected port information |
| G30 | Authorization status |